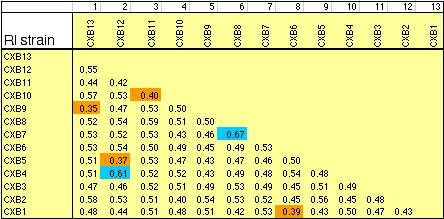
Monday

Standardized Choropleth Map


The standardized choropleth map to the left was found at the BBC website. It was described as a population density map. It shows the average density across regions.

Its URL is: http://www.bbc.co.uk/scotland/education/bitesize/standard/geography/population/distribution_density_rev3.shtml

DOQQ


The DOQQ map to the left is pointing to the Department of Conservancy in Sacramento, California. DOQQ maps are so highly praised for their degree of accuracy that older paper maps are being proved to be incorrect.

Lorenz curve


The Lorenze curve to the left was done by PennState. This curve is based on a country with a apparent unequal distribution of income. One of the most powerful things that this reveals is how rapidly the corruption increases at the highest percentage of the income population.

Index Value Plot


The graph to the left is an index value plot. It was a division under direction of the New Mexican government plotting their stream flow (water) index. This graph shows almost ten years of their flow index, and therefore allows the viewer to have a pretty good idea of what the average water flow index is.

Isopleths


The isopleth graph to the left is an ozone isopleth created by individuals concerned about the pollution levels of North Carolina. It was created by using a computer model based on ChemTest.

Cartographic Animations


The cartographic animation to the left, when seen in motion, shows the air temperature from 1959 through 1997. This was created, or at least published, by The University of Oregon in March of 2000. What the viewer can see is an actual progression of all the months of all the years that this study contains data for.

Its URL is: http://images.google.com/imgres?imgurl=http://uwacadweb.uwyo.edu/JSHINKER/animations/global/gifs/vmag500winds_web.gif&imgrefurl=http://uwacadweb.uwyo.edu/JSHINKER/animations/global/index.html&usg=__c6-ISlNc9_abWLDpvtG-AaXqeAo=&h=458&w=674&sz=455&hl=en&start=14&um=1&tbnid=SttdNmDh9QuDBM:&tbnh=94&tbnw=138&prev=/images%3Fq%3Dcartographic%2Banimations%26hl%3Den%26rls%3Dcom.microsoft:*:IE-SearchBox%26rlz%3D1I7GZFA%26sa%3DN%26um%3D1

Isoline Map


This is an isoline map of China. It displays the average water amounts used for winter wheat irrogation across these regions.


The URL for this map is: http://www.iwhr.com/webadmin/uploadfiles/wuhy2008714174748275.gif

Hypsometric Map


This map is a hypsometric, elevation, map of the town of Dummerston, Vermont. It shows the elevation progressions of this town by using various colors to indicate the progressions. This map also uses isohypses to show progression as well. This map was updated January of this year.
The URL for this map is: http://mappery.com/maps/elevation-map-of-dummerston-vermont.thumb.jpg

Similarity Matrix


This similarity matrix is using genotypes in a matrix system, and can therefore highlight specific strain similarities and abnormalities. Two strains of DNA were used in order to compile the data.

Stem & Leaf Plot


This is a back-to-back stem and leaf plot/graph. It is showing that one graph can be made from two different sets of data simply by keeping the numbers that do not change in the middle. For example, this graph shows pulse rate before and after exercise, but the middle numbers can be maintained, and therefore only one graph is needed instead of two.

The URL for this graph is: http://images.google.com/imgres?imgurl=http://www.tki.org.nz/r/maths/curriculum/statement/img/p210b.gif&imgrefurl=http://www.tki.org.nz/r/maths/curriculum/statement/glossary_e.php&usg=__ODKTW_zWVdWvBi680AlAKqFdAVk=&h=163&w=283&sz=7&hl=en&start=53&um=1&tbnid=0_rfOxpUjpSZAM:&tbnh=66&tbnw=114&prev=/images%3Fq%3Dstem%2Band%2Bleaf%2Bplot%26ndsp%3D18%26hl%3Den%26rls%3Dcom.microsoft:*:IE-SearchBox%26rlz%3D1I7GZFA%26sa%3DN%26start%3D36%26um%3D1

Windrose


The windrose testing graph to the left was downloaded from windtesting.com. The focus is looking into setting up turbines, and therefore using alternative fossil fuel energy. Graphs like this are more than helpful in background research being done in order to try to move into a different technology.

The windrose picture's URL is from: http://images.google.com/imgres?imgurl=http://www.windtesting.com/windrose.jpg&imgrefurl=http://www.windtesting.com/2.html&usg=__5zFeER3c93XHZar4XGJaGgLXoH0=&h=405&w=543&sz=48&hl=en&start=37&um=1&tbnid=T2MOpRn8mA_BNM:&tbnh=98&tbnw=132&prev=/images%3Fq%3Dwindrose%26ndsp%3D18%26hl%3Den%26rls%3Dcom.microsoft:*:IE-SearchBox%26rlz%3D1I7GZFA%26sa%3DN%26start%3D36%26um%3D1

Population Profile


This population profile is also a choropleth map. These two maps show the percentage of white/black population households in Brooklyn, NY. This is a data copulated map so that the government in Brooklyn, NY, can know the demographics for different things that it will need to use in order to dole out need based programs.

Infrared Aerial Photo


An Infrared aerial photo can loosely be described as "Photography in which an infrared optical system projects an image directly on infrared film, to provide a record of point-to-point variations in temperature of a scene." (answers.com). The photo to the left is an infrared photograph taken of Grover Island, and the colors clearly show that the top of the island/middle of the island (which is only 1.4 miles across...from east to west) seems to have the most activity/heat. The URL for this photo can be found at: http://images.google.com/imgres?imgurl=http://www.camdencountylandtrust.org/grover-aerial-for-web.jpg&imgrefurl=http://www.camdencountylandtrust.org/Grover%2520Island.htm&usg=__88QgpZ_sBXX9t42hp2htXp3Fytc=&h=310&w=497&sz=36&hl=en&start=40&um=1&tbnid=Afu4pMDoA6Z7EM:&tbnh=81&tbnw=130&prev=/images%3Fq%3Dinfrared%2Baerial%2Bphoto%26ndsp%3D18%26hl%3Den%26rls%3Dcom.microsoft:*:IE-SearchBox%26rlz%3D1I7GZFA%26sa%3DN%26start%3D36%26um%3D1

Range Graded Proportional Circle Map


A range graded proportional circle map is supposed to be a proportional circle map that "better" represents data circles with relation to their data. The map to the left better depicts the range (size and color wise) that seems to better represent its data. The URL for the map to the left is: https://blogger.googleusercontent.com/img/b/R29vZ2xl/AVvXsEjSF91vjH2s9YtJX6-PGpGNDKUZIh36GUBEKa_EF6uzDgXqEae3v5EITLKuhJV__eIyOKYaSy3widJ3vHCGIUYd9yjulItCeAF8XHJlnEbxUMTE7BNaVleZ8pfz3nEPrs0si_OrYmLrh3eo/s320/Range+graded+proportional+circle+map.gif

Continuously Varibale Proportioanl Circle Map


A continuously variable proportional circle map is, apparently, a map which uses circles to create "point data." The photo on the left is a map, with info dated September 17, 2003, was compiles to show Native American populations by certain states. Its URL is: http://vin25maps.blogspot.com/2009/04/continuously-variable-proportional.html