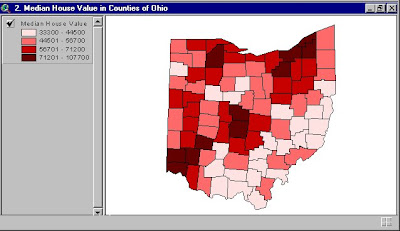
A bivariate chloropleth map is loosely defind by the fact that different colors are used to show no less than two different variables. What this means is that the picture at the left portrays different mean incomes across the State of Ohio. The URL for this site is: http://images.google.com/imgres?imgurl=http://gis.esri.com/library/userconf/proc99/proceed/papers/pap171/p1712.jpg&imgrefurl=http://gis.esri.com/library/userconf/proc99/proceed/papers/pap171/p171.htm&usg=__uD4P2FlZlF_cHz3qxOs5mAsouZs=&h=368&w=638&sz=45&hl=en&start=18&tbnid=Swd4yK7OA46fjM:&tbnh=79&tbnw=137&prev=/images%3Fq%3DBivariate%2BChoropleth%2Bmap%26gbv%3D2%26hl%3Den%26sa%3DX
No comments:
Post a Comment