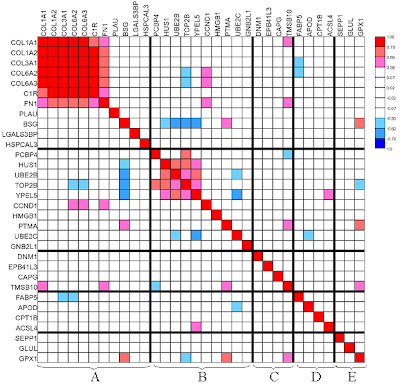
This is a gene to gene correlation matrix for a subset of 100 cancer genes. "Thick lines indicate blocks: A for extracellular matrix; B for nucleus and cell progression; C for actin cytoskeleton; D for fatty acid metabolism and E for glutamine/glutathioine/oxidative." (www.livestockgenomics.csiro.au/Genome_to_Phenome/)
No comments:
Post a Comment