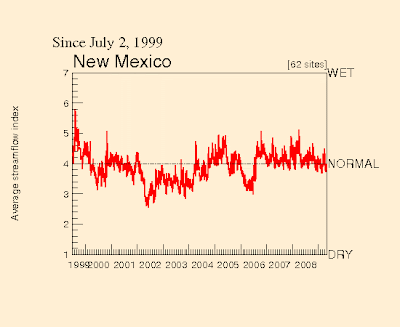
The graph to the left is an index value plot. It was a division under direction of the New Mexican government plotting their stream flow (water) index. This graph shows almost ten years of their flow index, and therefore allows the viewer to have a pretty good idea of what the average water flow index is.
No comments:
Post a Comment