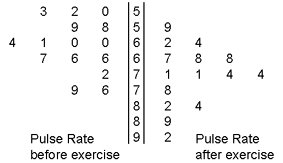
This is a back-to-back stem and leaf plot/graph. It is showing that one graph can be made from two different sets of data simply by keeping the numbers that do not change in the middle. For example, this graph shows pulse rate before and after exercise, but the middle numbers can be maintained, and therefore only one graph is needed instead of two.
I am here to discuss a simple definition regarding Stem and Leaf Plot as-In mathematics plot is where each last data value is split into a "leaf" and other digits into stem, example "56" would be split into "5" (stem) and "6" (leaf).
ReplyDelete